The Story of Naglich Squares
From handwritten mini‑grids to canvas apps and 3D stacks, this is the path I took—what clicked, what broke, and what I learned chasing symmetry in numbers.
Whole Numbers, Small Wonders
Early yearsI grew up speed‑running multiplication tables and noticing the wave—how patterns repeat across rows and down columns. That little hum never left. It taught me to look for the periodic piece and the core that everything else echoes.
Eventually I started to stack those ideas: what happens if I shift a row, then the next, then the next? That’s where the first cascades were born.
“If you stare long enough, the grid starts to hum. Numbers don’t just sit— they dance in formation.”
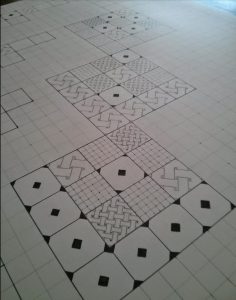
Grids, Knots & Meditative Lines
Sketchbook era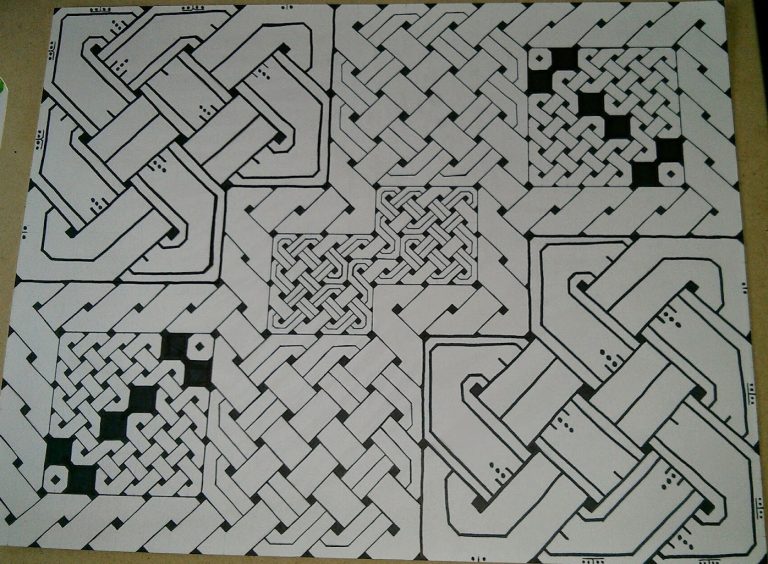
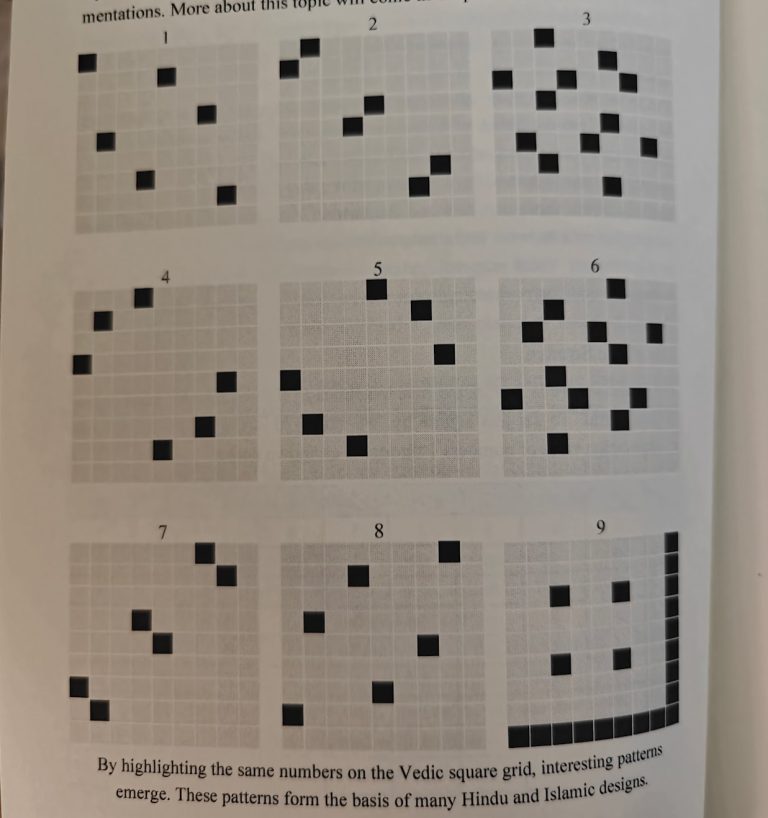
Drawing mini‑grids and Celtic knots turned into a calm daily practice. I’d sketch a boundary, protect a void, and weave lines until a pattern emerged. At the same time I was testing simple L→R cascades on paper. The motifs felt both made and found.
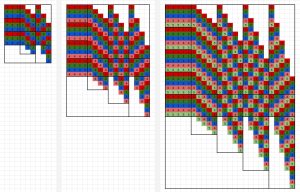
Copy, Paste, Pattern: The Spreadsheet Breakthrough
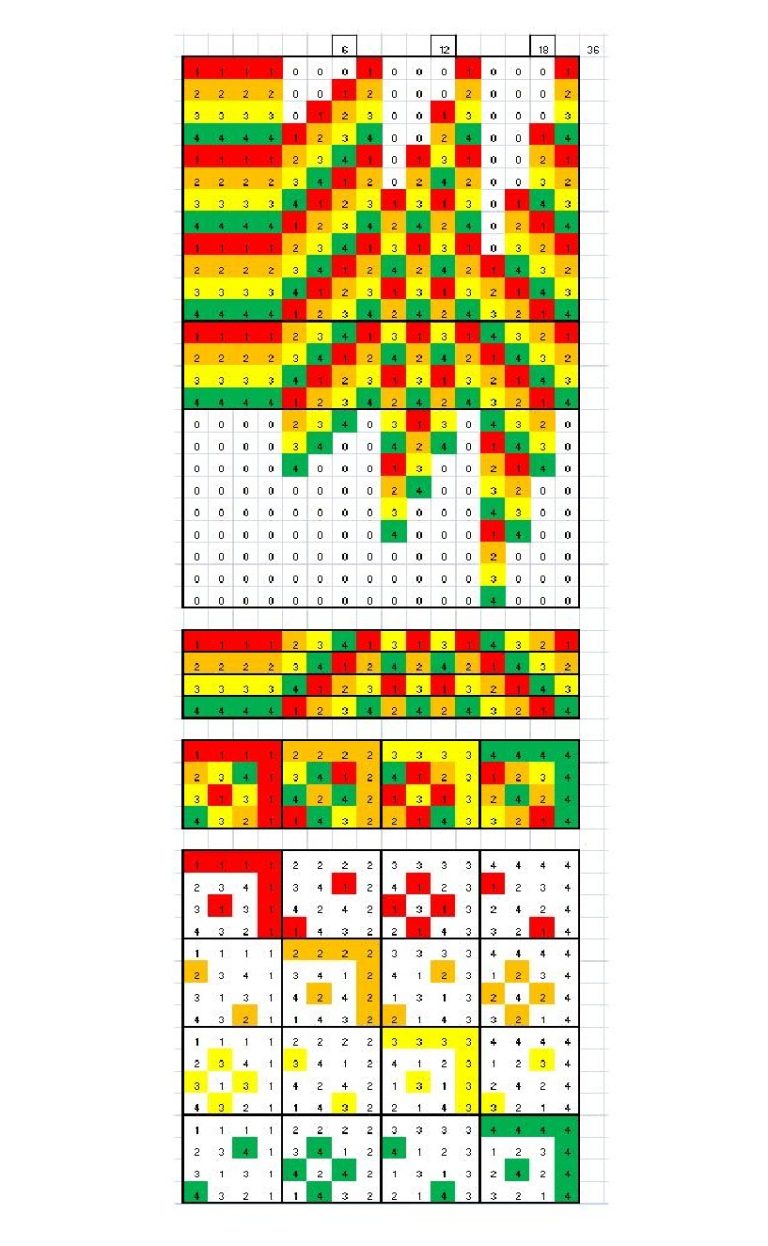
2010sSpreadsheets made iteration instant. I could stack cascades, recolor them, and push to bigger N without redrawing anything. That’s when chirality—the mirror behavior between L→R and R→L—became obvious.
I started capturing growth as animations: one slice, then the next, until a full square appeared and the repeating unit showed itself.
Scaling Up with “Machines”
2018 →
In 2018 a mutual friend introduced me to Joshua Conci (ApexPrimus) after noticing we both fall down rabbit holes about numbers and patterns. Josh wasn’t just using spreadsheets for bookkeeping—he was practicing number theory as an art form, building algorithmic machines in Microsoft Excel.
His modular‑multiplication intuition and spreadsheet engineering met my cascade experiments right where they needed help. We plugged my RL/LR ideas into his parameterized templates, and suddenly comparisons, flips, and shifts across larger N were seconds away instead of afternoons.
“We treated Excel like a generative loom—feed in a rule, pull a thread, watch the square weave itself.”
Giving It a Name
2024I finally named the project “Naglich Squares.” Giving it a name pushed me to clean up the math, write things down, and commit to a small, understandable core. That’s when the idea of an eight‑formula framework clicked.
I drafted a short white paper and started turning notebooks into working HTML demos with sliders, palettes, and export tools.
The Eight‑Formula Framework
2024 → 2025In plain language: two cores plus six controlled variations—enough to feel the family’s symmetry without getting lost.
RL — Base
Right‑to‑Left cascade anchored to k. Rows step in one direction; columns read the wave. My baseline for comparison.
LR — Base
Left‑to‑Right twin of RL. Same ingredients, mirrored chirality. Differences pop when you stack them.
RL — Row Flip
Reverse the row index. It feels like holding the square up to a horizontal mirror—great for spotting invariants.
RL — Transpose
Swap rows and columns. Many patterns survive the swap; the ones that don’t teach you where direction really matters.
RL — Column Shift −1
Slide every column one step. Small move, big effects—reveals which columns are bijections when gcd(c,N)=1.
LR — Column Shift +1
Mirror move on the LR side. I used this pair to debug wrap‑around logic and catch off‑by‑ones.
RL — 90° / 270° Rotations
Quarter turns that complete the symmetry picture. They balance the family and expose orientation‑specific quirks.
Combined View
Raw blend of RL/LR (and modular relatives) for side‑by‑side study. Where they agree is as interesting as where they clash.
I kept these tight on purpose. Each variant answers a small question. Together they form a map I can keep in my head while exploring larger N.
From 2D Boards to 3D Stacks
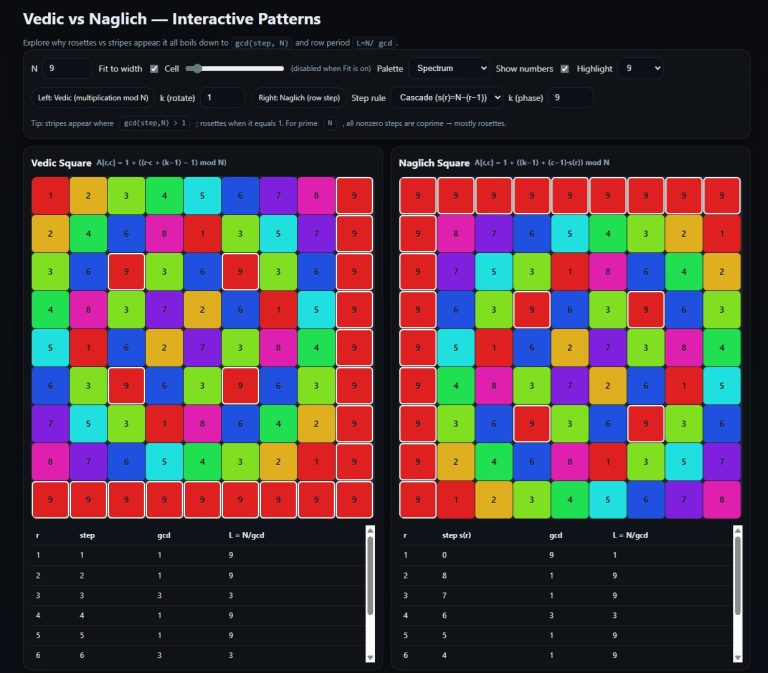
2024 → 2025I built a batch of canvas demos: RL/LR boards, a combined view, palette controls, and animation export (MP4/WebM/AVIF/GIF). The defaults adapt—set N and the k range fills in automatically.
Debug notes I’m oddly proud of: fixing LR row/column shift +1 wrap‑arounds; separating HSL “Rainbow” from “Classic Rainbow”; and a cleaner set of ten palettes with better loops.
The big leap was a 3D voxel view: stack each k slice as a layer. I broke lighting (everything went black), fixed it, then wired value‑to‑color correctly so the cube finally looked like the 2D boards I knew.
QCA Experiments: Stepping the Square
2025
I started prototyping a tiny “lab” with operators: allocate, updatePhase, scatter / shift / inverseShift, applyCoin, and paired steps (stepOnce / stepBack). It’s my way of testing reversible moves and seeing how chirality behaves when you evolve the state.
The UI is simple—N/k sliders always visible, exposure controls for the renderer, and toggles for 2D and GL views—but it’s enough to feel like I’m steering the math instead of just observing it.
Today & What’s Next
NowRight now I’m polishing the demos, refactoring the formula code, and trying bigger N on the GPU. I use local AI tools to scaffold experiments and write the rough drafts I’m too excited to outline.
Near‑term goals: a cleaner 3D stack viewer, better performance at large sizes, and a friendlier “explain mode” that teaches the patterns as you slide controls. Long‑term, I want to see where these squares land—in classrooms, in visualization, and maybe in places I haven’t thought of yet.